
Open Chart Palette Builder in your browser to create 5–9 series Categorical, Sequential, and Diverging data-visualization palettes with live Bar, Line, and Donut previews, CVD checks, and JS/Python/R code. Everything runs locally on your device with instant sync across the shared Active Palette bar.
Match the scale type to the structure of your data
Choose Sequential (default) for ordered low-to-high magnitudes, Categorical for distinct unordered series (regions, products, cohorts), or Diverging for zero-centered +/- variance.
Set your anchor #HEX and series count (5 to 9 series) on the left.
Keep line charts <= 5–6 series: Even with optimal colors, more than 6 overlapping 2px trend lines benefit from small multiples or direct labels.
Verify series separation under Deuteranopia and Grayscale
Use the Simulate dropdown right above the swatch strip to preview Deuteranopia, Protanopia, and Grayscale Print live on all three SVG charts.
Watch the Min ΔE badge on the bar chart—keeping minimum pairwise distance above 10 ensures adjacent slices and bars never blur together.
Sequential (Ordered Magnitude)
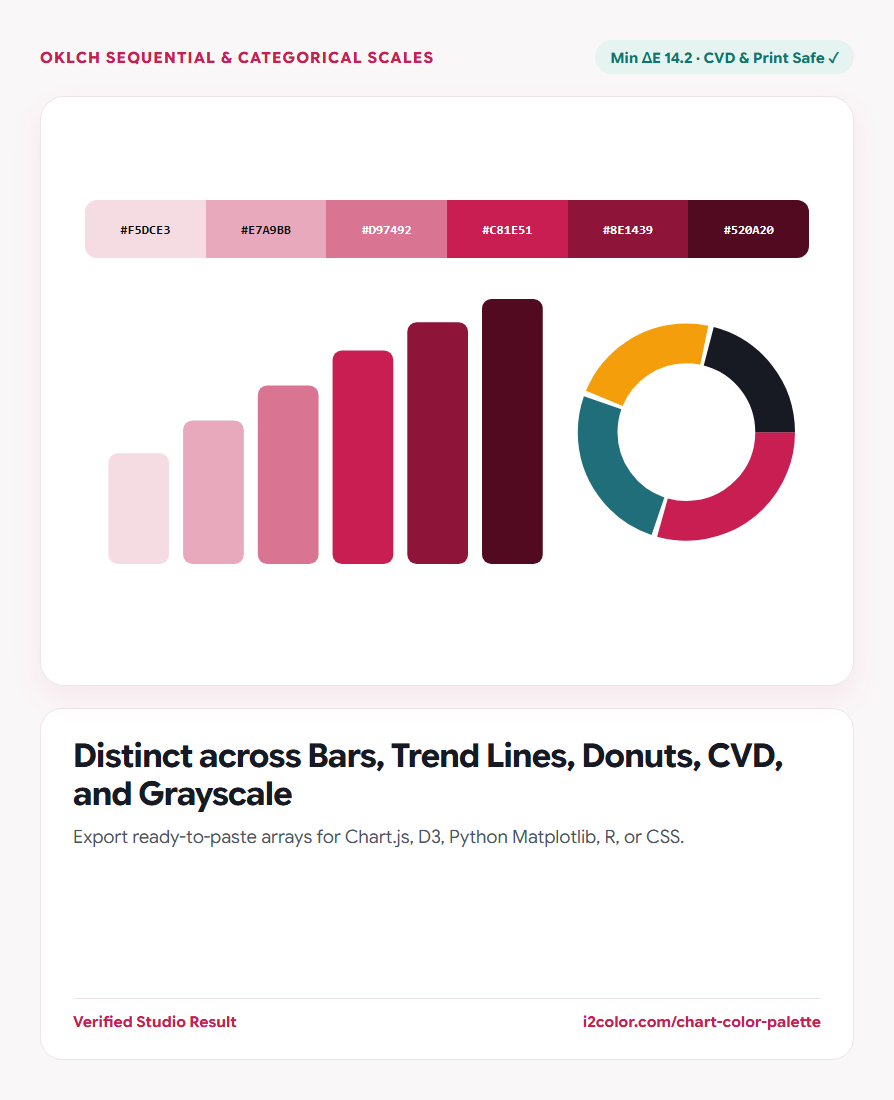
Steps OKLCH lightness smoothly from 90% down to 32% with subtle Bezier hue warmth.
Categorical (Unordered Groups)
Combines golden-angle hue rotation with staggered lightness so B&W print stays legible.
Diverging (+/- Midpoint)
Splits two complementary hues symmetrically around a calm neutral midpoint.
Export ready-to-paste arrays for your charting stack
Select JS / Chart.js, Python List, R Vector, or CSS Variables and click Copy Array.
// Ready for Chart.js, ECharts, Recharts, or D3
export const chartPalette = [
  '#F5DCE3', '#E7A9BB', '#D97492',
  '#C81E51', '#8E1439', '#520A20'
];Common questions
Why is Sequential the default mode?
Ordered numeric progressions (heatmaps, revenue tiers, conversion funnels) are the most frequent chart palette need and benefit immediately from smooth OKLCH lightness ramps.
Why stagger lightness in Categorical mode?
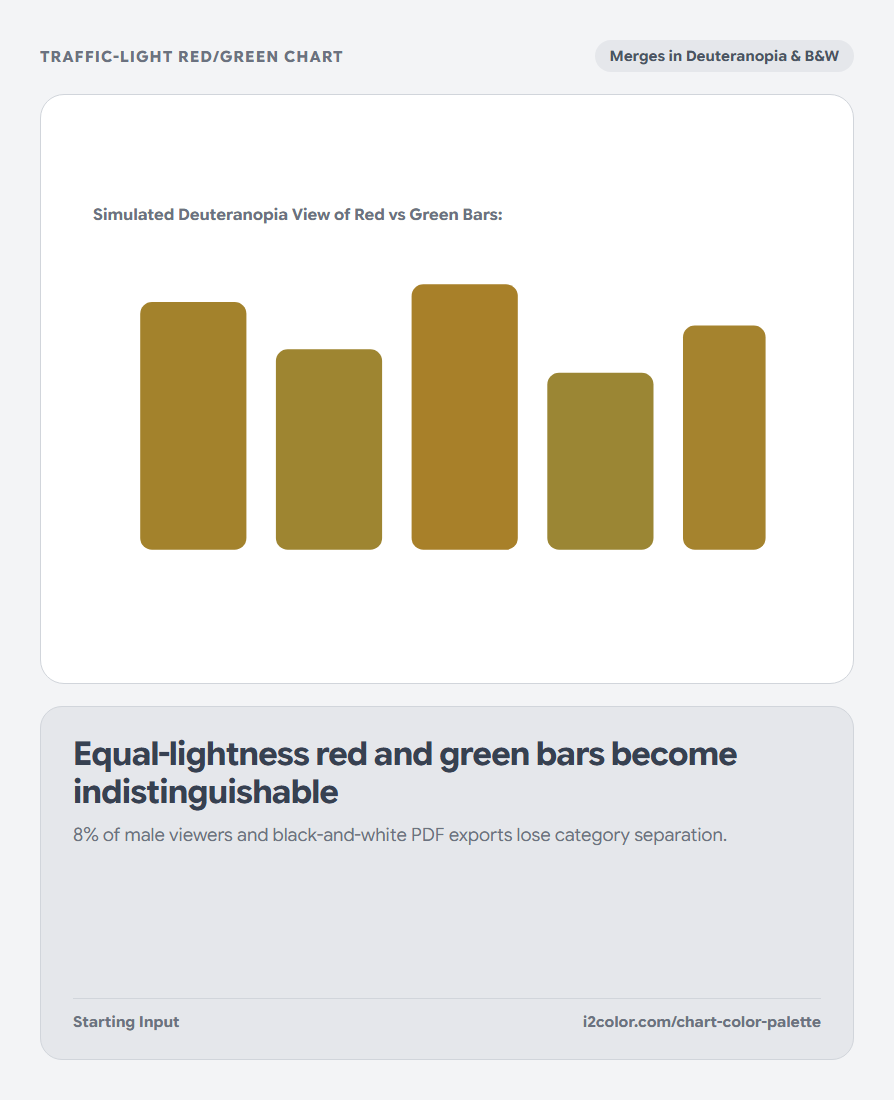
If two different hues share identical lightness, they collapse to the exact same gray when printed in black-and-white or viewed with monochromacy.
Can I copy a single series color from the strip?
Yes—click any S1..S9 cell in the series strip to copy its individual 6-digit #HEX code.
Try Chart Palette Builder
Build Categorical, Sequential, and Diverging scales tested for CVD and grayscale.